←Back to the journal
25 min read
Measuring the Wrong Thing, Fixing the Wrong Problem: Productivity, Interest Rates and Australia's Living Standards
By Mark Falzon
I have spent more than 45 years building and scaling businesses, and my companies have placed in the BRW Fast 100 four times. In none of them was productivity a number on a spreadsheet. It was better tools, better systems, better-trained people, and the confidence to invest in them.
That is why the current productivity debate troubles me.
On 29 September the Reserve Bank raised interest rates for the fourth time this year, and the Governor told the country that productivity is doing nothing. Weak productivity has become one of the main justifications for pushing rates higher and unemployment up. If the measure is wrong, or only half right, we are making some of the most consequential economic decisions in the country with a faulty instrument.
There is good reason to think it is at least half wrong. The standard measure divides GDP by hours worked. It cannot see a better hip replacement, a safer aged care home, or software that does in seconds what used to take a week. As more of our economy moves into care and knowledge work, more of what we produce falls outside the ruler.
But I don't accept the comfortable view either. Outside the data centre boom, business investment has been weak for more than a decade. Competition in key markets is thin, housing is too slow and too expensive to build, and too many good Australian ideas never reach scale. Those problems are real, and every rate rise makes them worse.
This paper looks honestly at both sides: what the numbers say, where they mislead, and what Australia should do about it. It is a companion to my earlier paper on interest rates, because the two problems are now tied together. We are using a broken ruler to justify a blunt instrument, and the people paying for it are the same households in both cases.
Australia can do better on both counts. The tools exist. What we need is the willingness to measure honestly, invest seriously and stop treating productivity as a slogan.
Mark Falzon
Australia has two productivity problems, and it is treating them as one. The first is real: outside a narrow boom in data centres, the economy is not investing, competing or building enough to lift output per worker. The second is a measurement problem: the standard ruler cannot see much of what a modern care and knowledge economy produces. Policy is now leaning heavily on the flawed number, using it to justify higher interest rates, while doing too little about the real problem. Higher rates then make the real problem worse.
Australia should stop arguing about a single headline number and start managing productivity like a business manages performance: with better measures, clear targets and sustained investment. That means fixing the ruler, so the care and knowledge economy is counted properly; keeping a flawed figure from driving interest rate decisions on its own; and attacking the real barriers of weak investment, thin competition, slow housing construction and slow technology adoption. It also means making sure the gains flow to workers as higher real wages, because productivity that does not lift living standards will not keep public support.
# |
Action |
Who |
When |
|---|---|---|---|
1 |
Publish an official quality-adjusted productivity series for health, education and care alongside the headline measure |
ABS, Productivity Commission |
12 months |
2 |
Require the RBA to publish how its rate settings change under alternative productivity estimates, and stop relying on a single measure of unit labour costs |
RBA, Treasury |
Next Statement on Monetary Policy |
3 |
Redesign business tax to reward investment, with faster write-offs for productive capital, especially for small and medium firms |
Treasury |
Next budget |
4 |
Fully implement the revived National Competition Policy and use the new merger regime to keep concentrated markets contestable |
Treasury, states, ACCC |
1 to 3 years |
5 |
A national AI and digital adoption program for small business, focused on diffusion rather than invention |
Industry department |
12 months |
6 |
Lift construction productivity: planning reform, a harmonised national building code and support for modular building |
Commonwealth, states |
1 to 3 years |
7 |
Reform care funding to pay for outcomes and fund technology adoption in health, aged care and disability services |
Health and social services departments |
2 to 3 years |
8 |
Strengthen business dynamism: end non-compete clauses for most workers and make it easier to start, scale and close firms |
Treasury, Attorney-General |
1 to 2 years |
9 |
Deliver the energy transition at least cost, to give business cheaper and more reliable power |
Energy department, AEMO |
Ongoing |
10 |
Publish an annual Productivity and Living Standards Statement that tracks real wages, labour share and quality-adjusted output |
Treasury, Productivity Commission |
Annually |
The rest of this paper sets out the evidence and the detail behind each step.
On the official measure, Australian labour productivity has gone nowhere for six years. GDP per hour worked in June 2026 was at the same level as in December 2019: output and hours worked have both grown about 14% since then, and almost nothing has been gained per hour (Aard, from ABS data).
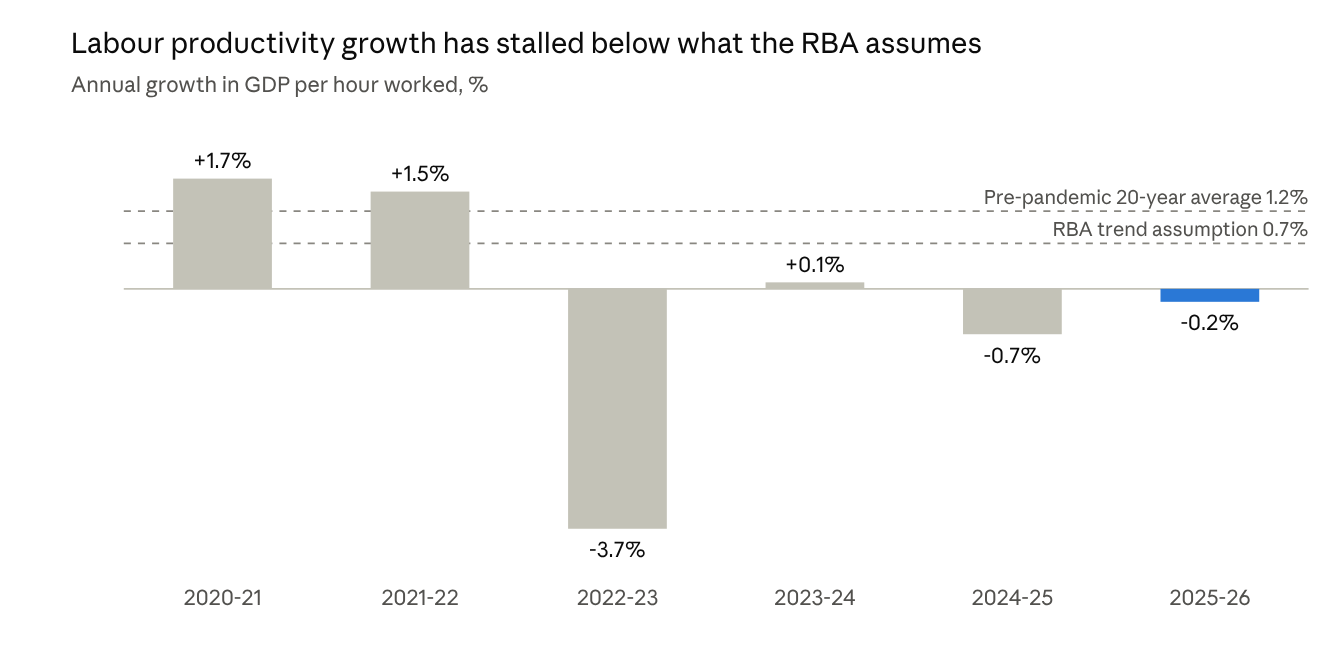
ABS Australian System of National Accounts 2024-25 (financial years); ABS National Accounts June quarter 2026 (2025-26 = year to June quarter); averages from PC and EY; assumption from RBA SMP August 2026
The recent run sits well below both the pre-pandemic average and the 0.7% a year the RBA now assumes in its forecasts. The pandemic years are distorted (hours collapsed faster than output in 2020-21, then recovered in 2022-23), but the picture since is consistently flat to negative.
Measure |
Latest reading |
Source |
|---|---|---|
Market sector labour productivity |
Down 0.1% over the year to June 2026; up 7.5% since June 2014 |
|
Non-market sector labour productivity |
Down 0.3% over the year; down 2.5% since 2014; below its March 2007 level |
|
Nominal unit labour costs |
Up 3.6% over the year to June 2026 |
|
RBA trend productivity assumption |
0.7% a year (cut from 1.0% in August 2025) |
|
Private new capital expenditure |
Up 10.7% over the year, driven by data centres; down 3.6% in the June quarter |
|
Real net national disposable income |
Unchanged in the June quarter 2026 |
The slowdown predates the pandemic. The Productivity Commission Chair, Danielle Wood, dates the real break to 2016, when productivity essentially flat-lined. This is a decade-long problem, not a post-COVID hangover.
The two sectors are moving in opposite directions. Market sector productivity has grown steadily over the past decade. The decline is concentrated in the non-market sector, which has also grown rapidly as a share of the economy. That combination drags the headline down even if no individual worker is less productive (a composition effect), and it is exactly where measurement is weakest.
Investment is booming in one place only. Capital spending is up strongly, but the ABS attributes most of the surge to server racks and processing equipment for data centres, much of it imported. Beyond data centres and renewable energy projects, the investment outlook is subdued, partly because of higher interest rates (AAP). Imported servers add capacity, but on their own they do little for the productivity of the wider workforce.
Productivity is not an abstract statistic. Over time it is the only sustainable source of higher real wages, and in the short run it sets how much wage growth the RBA will tolerate before it raises rates. That second link is why the measurement debate matters so much right now.
The RBA's own framework says long-run wage growth consistent with full employment and inflation on target equals the 2.5% inflation midpoint plus productivity growth. At that rate, labour costs per unit of output (unit labour costs) rise in line with target inflation and firms face no extra pressure to raise prices (RBA).
That makes the productivity assumption a direct input into how high interest rates go.
Productivity assumption |
Wage growth the RBA treats as safe |
What it means for policy today |
|---|---|---|
0.7% a year (current RBA assumption) |
About 3.2% |
Wages are at the limit; any further strength is read as inflationary and argues for higher rates |
1.2% a year (pre-pandemic 20-year average) |
About 3.7% |
Current wage growth sits comfortably within the safe range |
Measured unit labour cost growth, year to June 2026 |
3.6% |
Read by the RBA as elevated, and cited as evidence the labour market is still too tight |
In August 2025 the RBA cut its trend productivity assumption from 1.0% to 0.7%. That one decision lowered the bar for "safe" wage growth by 0.3 percentage points and lowered its estimate of how fast the economy can grow without inflation. Both feed directly into the case for higher rates.
Unit labour costs are calculated by subtracting measured productivity from labour cost growth. If productivity in the care and knowledge sectors is understated, unit labour costs are overstated by the same amount, and the economy looks more inflationary than it is. The Productivity Commission's own work found quality-adjusted productivity in health care growing about 3% a year, far above what the headline measure records for the non-market sector (Cambridge, citing the PC).
It would be wrong to claim this explains the whole gap: the market sector, which is measured reasonably well, has also slowed. But even a modest understatement, applied across a non-market sector that now employs a large and growing share of Australians, is enough to change how tight the labour market looks. And that is exactly the judgement on which the September rate rise rested.
Over the long run the link is simpler. Real wages can only rise sustainably if each hour of work produces more. Former Treasury Secretary Ken Henry estimates that the productivity slowdown has cost workers around $500,000 in forgone pay rises over the past 25 years (ABC). Economist Chris Richardson estimates that if productivity growth stays at 0.7% rather than Treasury's 1.2%, the annual budget balance could be about $40 billion worse by 2034-35 (same source). Real net national disposable income, the broadest measure of material living standards, did not grow at all in the June quarter.
The RBA's own submission to the Senate Select Committee on Productivity puts it plainly: productivity makes goods and services cheaper, supports real wage growth and drives growth in real incomes per person (RBA). On that, every side of the debate agrees.
Both camps in this debate are partly right. Some of the slowdown is an artefact of how we measure. Some of it is real, and the real part is where policy should focus.
Quality is invisible. In health, education and care there is no market price, so output is largely measured by inputs or activity (patients treated, students enrolled, hours of care). A treatment that cures faster, a school that teaches better or an aged care home that keeps residents safer can all show up as flat or falling productivity. The Productivity Commission concedes traditional measures miss quality, and found that adjusting for it lifts health care productivity growth to about 3% a year.
The economy has shifted toward what is hardest to measure. Non-market health, education and care services have grown particularly fast over the past decade, with the NDIS and aged care expansion at the centre. This shift lowers the headline average even if productivity within every sector were unchanged. The RBA itself acknowledges the growing non-market share as one of the factors behind the slowdown.
Digital and intangible output is undercounted. Free online services, better software and improvements in quality that do not change prices are poorly captured everywhere. International researchers such as Diane Coyle in the UK have documented the gap between measured output and what a digital economy delivers.
Mining distorts the average. The RBA notes sharp falls in mining productivity as companies tap lower-grade deposits. That is a real cost for those firms, but it says little about the productivity of the rest of the workforce.
Weak investment. Danielle Wood points to business investment that has not recovered since the GFC, meaning less technology and less capital per worker (CommBank). The current data centre surge is real but narrow and import-heavy.
Fading business dynamism. The RBA's research shows fewer workers moving to new and young firms, which slows the shift of labour and capital to more productive businesses. Lower dynamism is linked to weaker competition in concentrated markets (RBA).
Housing and construction. Construction productivity has lagged for decades. Slow approvals, fragmented building codes and high costs mean Australia builds too few homes too slowly, which also keeps workers from moving to where the best jobs are.
Slow technology adoption. Australia is good at buying technology and less good at using it. Many small and medium firms trail the frontier in digital and management practices, and the gap between the best firms and the rest is wide.
Regulation and energy. Overlapping approvals, state-by-state rules and an energy transition that has raised costs during the changeover all weigh on output per hour.
Interest rates themselves. Higher rates raise the hurdle for new investment, stall housing construction and discourage the start-ups and expansions that drive dynamism. A tool used to compensate for weak productivity also suppresses the investment that would lift it.
Factor |
Mostly a measurement issue or real? |
Who can fix it |
|---|---|---|
Quality of health, education and care not captured |
Measurement |
ABS, Productivity Commission |
Shift toward care services |
Both: composition effect plus genuinely weak measured output |
ABS; care funding reform |
Digital and intangible output |
Mostly measurement |
ABS, international standards |
Mining depletion |
Real, but sector-specific |
Little policy role |
Weak non-data-centre investment |
Real |
Treasury (tax), RBA (rates) |
Low dynamism and competition |
Real |
Treasury, ACCC, states |
Housing and construction |
Real |
States, Commonwealth |
Slow technology and AI adoption |
Real |
Industry, skills, small business programs |
High interest rates |
Real, and self-inflicted |
RBA, with government tools that share the load |
Recent commentary, including an Independent Australia analysis published on 12 October 2026, argues that productivity is actually strong and only the measure is broken (Independent Australia). It is right that the ruler is broken in important places, right to challenge the RBA's reliance on it, and right that strong employment and solid market sector performance contradict the picture of a failing economy.
Some of the evidence it relies on does not hold up, though, and the case is stronger without it. Strong job creation is not proof of productivity: if output and hours both grow 2%, employment rises while output per hour stays flat. Record luxury spending and imports reflect income and wealth at the top as much as productivity across the workforce. And the investment surge is real but concentrated in data centres. The credible position is that Australia's productivity is understated and also underperforming. Both need fixing, and the first should not be used to excuse the second.
Australia has lifted productivity before, and the lesson of each period is the same: big gains came from sustained, bipartisan reform that opened markets and encouraged investment, not from any single measure. Figures below are approximate and drawn from the historical record.
Period |
What happened |
Productivity outcome |
Lesson |
|---|---|---|---|
1983 to 1991 |
Dollar floated, financial deregulation, tariff cuts begin, Accord with unions |
Foundations laid; gains came later |
Opening the economy takes years to pay off |
1993 to 2000 |
Hilmer review (1993) and National Competition Policy (1995), with Commonwealth payments to states for reform; enterprise bargaining; ongoing tariff cuts |
Labour productivity growth of roughly 2% or more a year through the late 1990s, among the best in the developed world |
Competition reform, funded and coordinated across governments, delivers |
2000s mining boom |
Huge investment in mines; reform momentum fades |
Productivity slowed as capital took years to produce output; mining productivity fell |
Booms can mask the need for reform |
2015 to 2016 |
Harper competition review; limited implementation |
Productivity flat-lines from about 2016 |
Reviews without implementation achieve little |
2020 to 2023 |
Pandemic swings, then a 3.7% fall in 2022-23 as hours recovered faster than output |
Volatile, little net gain |
Short-run data are noisy; trends matter |
2023 |
Productivity Commission five-year inquiry, Advancing Prosperity |
Broad agenda set out |
Clear diagnosis, slow uptake |
2025 to 2026 |
Economic Reform Roundtable (August 2025); PC's five pillars inquiries with 47 recommendations (December 2025); revived National Competition Policy; mandatory merger notification regime; tax reform in the 2026 Budget |
Too early to show in the data |
Momentum is back; delivery is the test |
The 1990s show what works. National Competition Policy succeeded because the Commonwealth paid the states to reform, the reforms were monitored independently, and the program ran for a decade across governments of both colours. The revived National Competition Policy, which again pays states to fix poorly designed regulation (Inside Small Business), is the closest thing Australia has had to that model in 30 years.
The 2016 to 2025 period shows what fails: reviews that are commissioned, praised and shelved. The Treasurer says more reform has been delivered in the year since the Roundtable than in the previous quarter century, with more than 60 reforms under way (ALP). That claim will be judged by the productivity data over the next five years, not by the count of announcements.
Australia is not alone. Most advanced economies have seen productivity slow since the mid-2000s, and several have done more than Australia to measure it properly and to lift it. The examples below are drawn from the historical record (approximate).
Country / measure |
What it did |
Relevance to Australia |
|---|---|---|
United Kingdom, quality-adjusted public service productivity |
Since the Atkinson Review (2005), the Office for National Statistics publishes public service productivity adjusted for quality, such as health outcomes and exam results |
A tested model for the ABS: measure care and education by results, not just activity |
United States, productivity rebound |
Productivity growth picked up from 2023, linked to a surge in new business formation, tight labour markets that pushed firms to invest, and faster technology adoption |
Dynamism and investment matter more than any single reform |
Denmark and the Netherlands, independent productivity bodies |
Standing councils and planning bureaus that publish regular, apolitical assessments and cost reform options |
Australia already has a strong Productivity Commission; the gap is in government follow-through |
Singapore, SkillsFuture and digital adoption grants |
Lifelong learning credits for workers and co-funded technology adoption for small firms, sector by sector |
A practical model for spreading AI and digital tools beyond large firms |
New Zealand, Living Standards Framework |
Treasury assesses policy against wellbeing measures alongside GDP |
Australia's Measuring What Matters framework (2023) is a start; it needs to be linked to decisions |
New Zealand, abolition of its Productivity Commission (2024) |
Folded its functions back into government |
A warning: independent capacity is easy to lose and hard to rebuild |
European Union, competition and single market reform |
Ongoing work to remove barriers between member states |
The parallel for Australia is regulation that still differs state by state |
Countries that have done better share three habits. They measure the services sector honestly, so they know where the problem actually is. They keep markets contestable, so new firms can challenge old ones. And they treat technology adoption by ordinary firms as the main game, rather than invention by a few. None of them relies on interest rates to compensate for weak productivity, because no central bank can raise output per hour by cutting demand.
AI is the largest productivity opportunity Australia has had in a generation, and right now it is showing up in the statistics mainly as a cost. How the country handles the next five years will decide which of those it turns out to be.
The Productivity Commission estimates AI could add about 4% to labour productivity over the decade (CommBank). That is more than all the labour productivity growth recorded across the whole economy since 2014 (3.6%). The gains are largest in exactly the sectors where productivity is weakest or hardest to measure: health administration, aged care documentation, legal and financial services, education and public administration.
The build comes before the benefit. Data centre investment has risen for eight straight quarters and dominates business investment. That spending adds to demand and, as the RBA notes, to capacity pressure now. The productivity payoff comes later, when firms across the economy use what is being built.
Adoption is uneven. Large firms are moving quickly; most small and medium businesses are not. Productivity gains from general-purpose technologies have historically come from diffusion through ordinary firms, which takes skills, management capability and confidence to invest. That is the gap Australia most needs to close.
The ruler may miss it. A clinician who uses AI to cut paperwork and spend more time with patients produces better care, not more measured output. A lawyer who produces the same advice in half the time may bill fewer hours. Much of AI's early value will show up as quality and time saved, which is precisely what the current measures fail to see. Without better measurement, AI could make the economy more productive while the headline number barely moves.
AI will also displace work, and the costs will fall unevenly. If productivity gains flow mainly to capital and a few large firms, the result will be higher profits without higher wages, which is the pattern many Australians already suspect. Policy needs to support transitions for affected workers and ensure the gains are shared, or public consent for the technology will not last.
The RBA currently assumes productivity will recover only to 0.7% a year. If AI delivers anything close to the Productivity Commission's estimate, that assumption is too pessimistic, the economy can grow faster without inflation, and current rate settings are tighter than they need to be. At a minimum, the RBA should publish how its forecasts change under an AI-driven productivity scenario, so the public can see how much of the current tightening rests on a pessimistic assumption.
The recommendations fall into two groups. The first fixes how productivity is measured and used in policy, so a flawed number stops driving interest rates. The second attacks the real barriers. Neither works without the other.
1. An official quality-adjusted productivity series. The ABS and the Productivity Commission should publish, alongside the headline measure, productivity for health, education and care adjusted for quality and outcomes, following the UK model. The Productivity Commission has already shown it can be done for health care. Publishing it officially, every year, would give policymakers and the public a truer picture of where the economy is and is not improving.
2. Stop a single number from setting interest rates. The RBA should publish how its assessment of labour market tightness and its rate settings change under alternative productivity estimates: the current 0.7% assumption, the pre-pandemic 1.2% average, a quality-adjusted measure and an AI scenario. It should give less weight to headline unit labour costs while the non-market sector distorts them, and say so openly. This sits naturally with the Supply Shock Protocol and distributional reporting proposed in my interest rate paper.
3. Tax that rewards investment. Redesign business tax so it rewards firms that invest, with faster write-offs for productive capital and particular attention to small and medium firms, which face the highest effective cost of capital. The Productivity Commission has put forward options for a company tax redesign along these lines; government should act on them.
4. Competition with teeth. Fully fund and implement the revived National Competition Policy, using the 1990s model of payments to states tied to verified reform. Use the new mandatory merger regime to stop further concentration in markets that are already thin, and give the ACCC the resources to act on it.
5. AI and digital adoption for small business. A national program focused on diffusion, not invention: co-funded adoption grants, practical training for owners and managers, and sector-specific playbooks, along the lines of Singapore's model. The goal is to get the tools already available into the hands of the hundreds of thousands of firms that are not yet using them.
6. Build faster and cheaper. Housing and construction need a national effort: planning reform with firm approval deadlines, a single harmonised building code, recognition of modular and prefabricated building across all states, and skills programs for the trades. Faster building also lets workers move to where the best jobs are.
7. Pay for outcomes in care. The Productivity Commission's five pillars inquiry called for breaking down the siloed approach to the care economy. Funding for health, aged care and disability services should reward outcomes rather than activity, and should fund the technology that frees care workers to spend more time on care.
8. Strengthen business dynamism. Build on the planned restrictions on non-compete clauses for most workers, simplify the rules for starting, growing and closing a business, and make it easier for capital and workers to move to the firms that use them best.
9. Cheaper, reliable energy. Deliver the energy transition at least cost, as the Productivity Commission has urged, so business has the affordable, reliable power that productive investment depends on.
10. A Productivity and Living Standards Statement. Treasury and the Productivity Commission should publish an annual statement that tracks headline and quality-adjusted productivity, real wages, the labour share of income and progress on every reform. Productivity has to be seen to lift living standards, or public support for reform will not last.
Objection |
Why it matters |
Response |
|---|---|---|
"Mismeasurement" is an excuse to avoid hard reform. |
If every weak number is blamed on the ruler, nothing gets fixed. |
Agreed. This paper treats measurement and real performance separately, and most of its recommendations address the real problem. Better measurement makes it harder, not easier, to hide underperformance. |
The market sector, which is measured well, has also slowed. |
It shows the problem is not only statistical. |
True. Market sector growth has been positive over the decade but below its past pace. That is why investment, competition and adoption reforms lead the agenda. |
Quality adjustment is subjective and could flatter the numbers. |
Statistics must be trusted to be useful. |
The UK has published quality-adjusted series for nearly two decades under independent statisticians. Publish both measures side by side, with the method open to scrutiny. |
Asking the RBA to discount unit labour costs risks letting inflation run. |
Credibility matters. |
The RBA would not ignore labour costs; it would publish how its view changes under different productivity estimates. Transparency about an uncertain input strengthens credibility. |
Tax incentives for investment cost revenue. |
Budgets are already under pressure. |
Design matters: targeted write-offs for productive capital, paid for by closing concessions that reward speculation rather than investment. Weak productivity costs the budget far more over time. |
Productivity gains may not reach workers. |
If gains flow only to profits, support for reform collapses. |
Track the labour share and real wages every year, and keep strong bargaining institutions. The ACTU argues businesses have stopped investing in skills; employers point to workplace rules. Both claims should be tested with data, not assumed. |
AI could destroy more jobs than it creates. |
Displacement costs fall on specific workers and regions. |
Fund transitions and retraining, and measure the effects as they happen. Australia's choice is not whether AI arrives, but whether it adopts it well or late. |
Productivity reform has a credibility problem with ordinary Australians. For years they have been told that productivity is the path to higher wages, while profits grew and real wages went backwards. The current period, with record bank profits, falling real wages and an RBA citing weak productivity as a reason to push unemployment up, reinforces that suspicion.
The fix is to make the gains visible and shared: higher real wages, cheaper services, shorter waits for care, more affordable housing. Reform that delivers those things will have support. Reform that is used mainly to justify wage restraint and higher interest rates will not, and should not.
Australia's productivity debate has become a contest between two slogans: "productivity is broken" and "the measure is broken". Both are partly true, and neither is a policy. The official number understates what a modern care and knowledge economy produces, and it is being given too much weight in decisions about interest rates and wages. At the same time, investment outside data centres is weak, competition is thin, housing is slow to build and technology spreads too slowly through ordinary firms.
The way forward is to separate the two problems and act on both. Fix the ruler, so the country knows where it is really improving. Stop a single, flawed figure from driving rate rises that suppress the very investment productivity depends on. And get on with the reforms that lift output per worker: tax that rewards investment, competition with teeth, faster building, practical AI adoption for small business, and care funded for outcomes.
Australia did this in the 1990s, when sustained, funded and bipartisan reform delivered some of the strongest productivity growth in the developed world. The country now has better data, better tools and a technology wave that could lift productivity more than anything since. The difference between a decade of stagnation and a decade of rising living standards is whether we measure honestly, invest seriously and make sure the gains reach the people doing the work.
Data accessed 16 October 2026. Historical figures in sections 4 and 5 are approximate and drawn from the public record; they should be checked against primary sources before publication.